The SenTool(TM) software is part of the radar developer kits. It is a Graphical User Interface (GUI) for radar parameter settings and radar data visualization. SenTool makes it easy to configure each "sentire Radar" and to measure, visualize and analyze the radar data in different plots. SenTool is specifically adapted to the individual sentire radar modules by IMST.
SenTool offers a wide range of functions
-
Radar selection out of several connected radars (e.g. Ethernet or USB)
-
Configuration of radar parameters and interface settings
-
High level measurement modes: time domain, range FFT, Doppler FFT, magnitude map, peak map, CFAR, detections, tracking
-
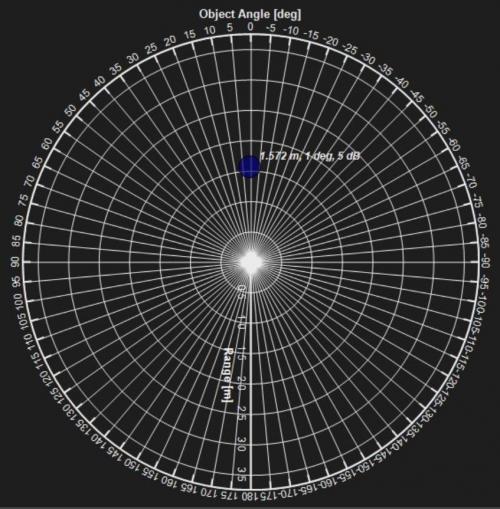
Measurement data monitoring in different plots: cartesian, polar, 3-D, range-Doppler
-
Plot settings: zoom, markers, multiple curves, multiple plots, max hold ...
-
Data storing in different formats
-
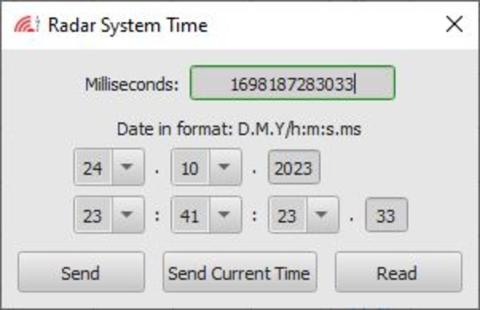
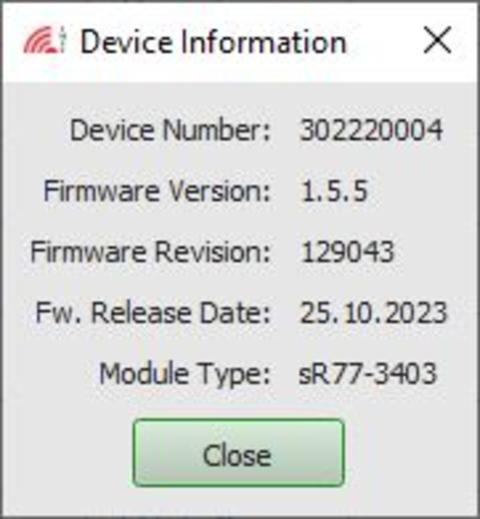
Additional tools: firmware update, data stream recoder and player
-
Integrated help
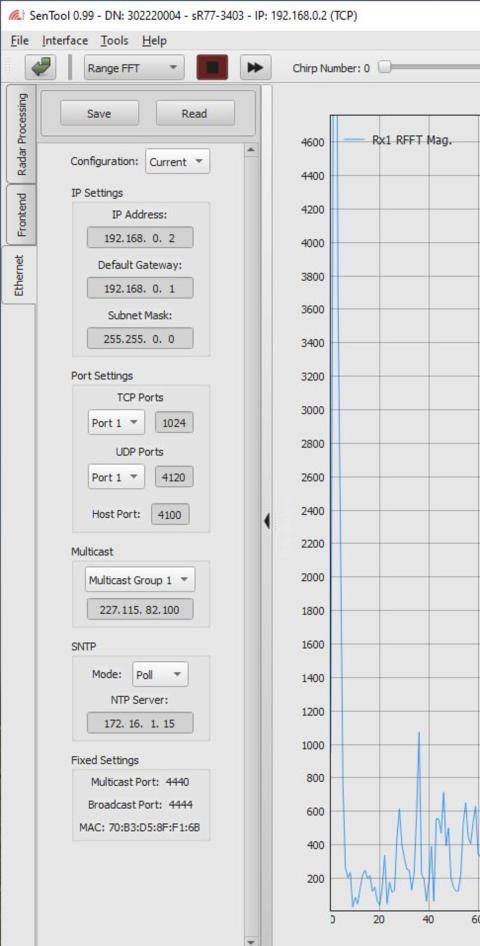
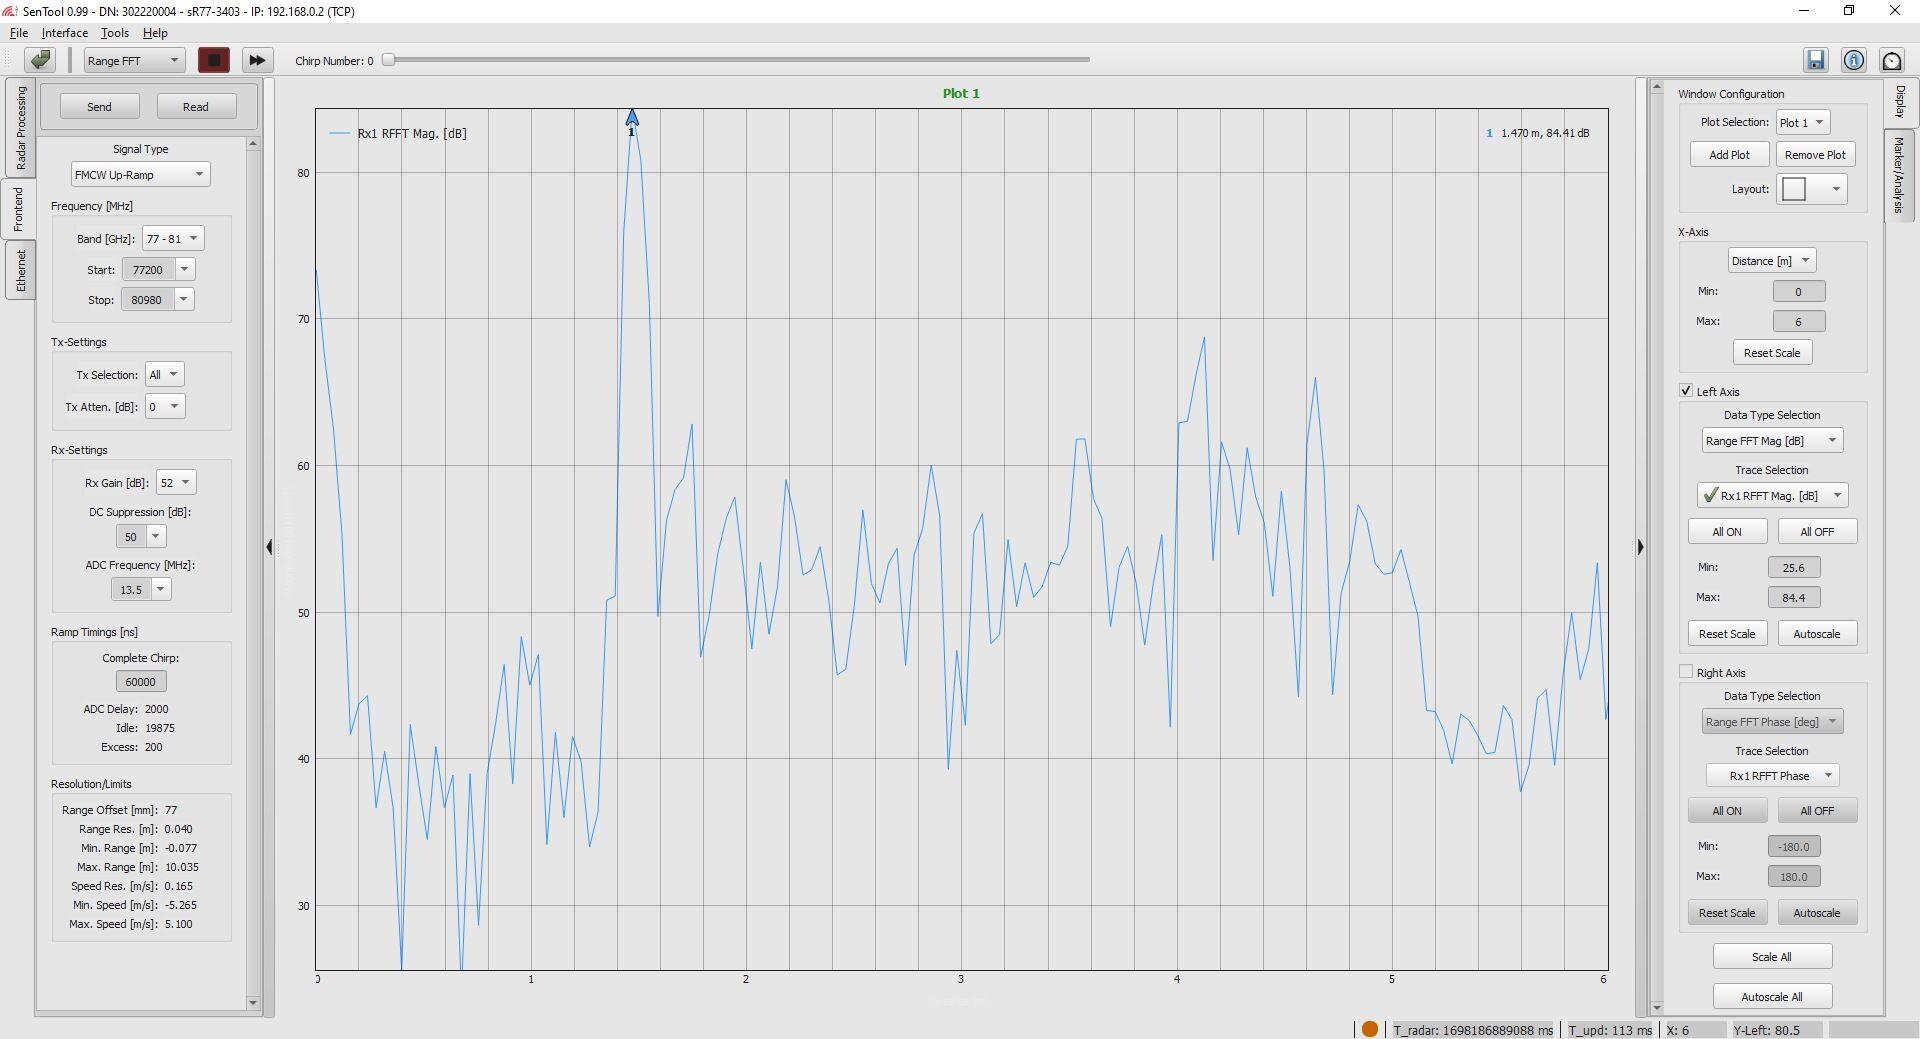
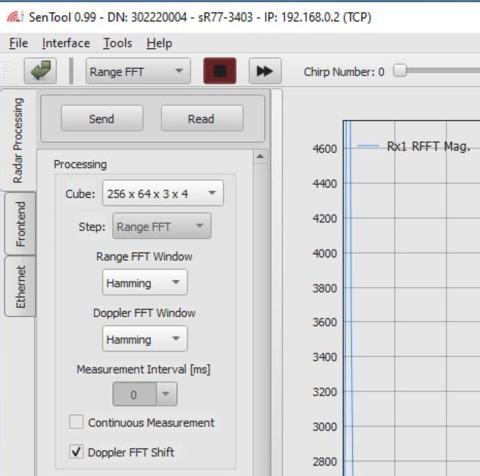
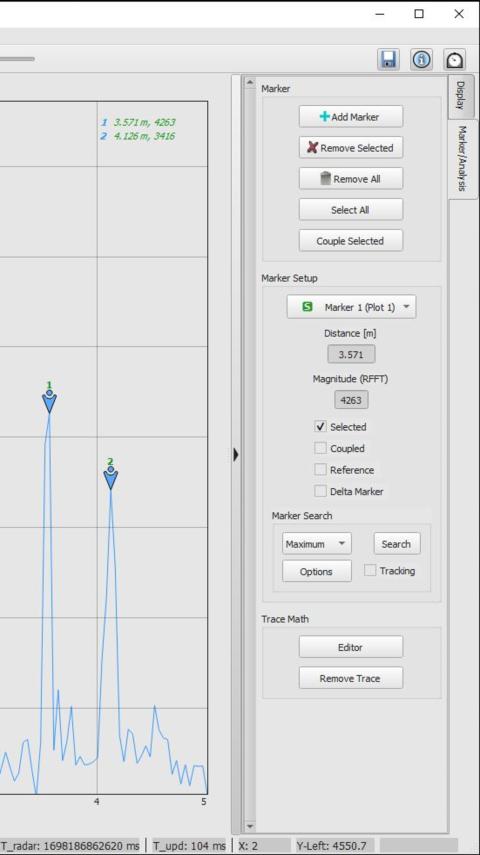
SenTool Main Window with range-FFT plot
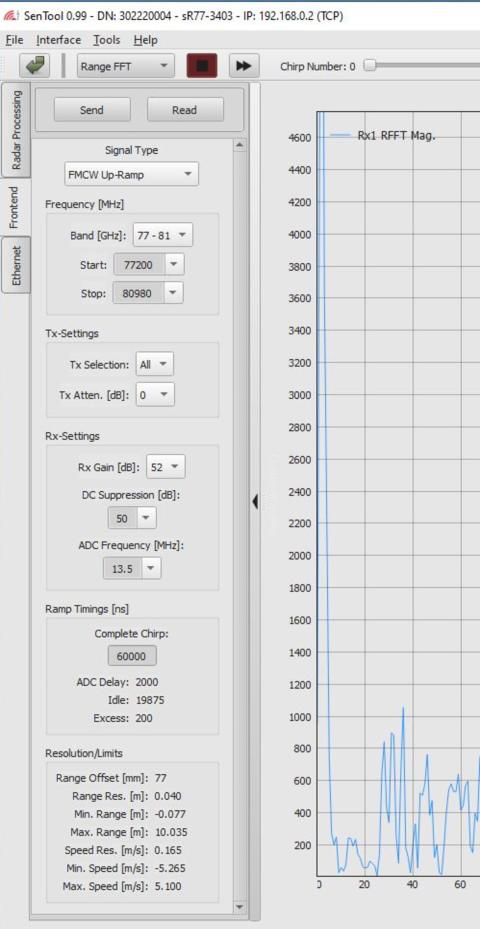
Left side Tabs for parameter settings: Radar Processing, Frontend and Ethernet
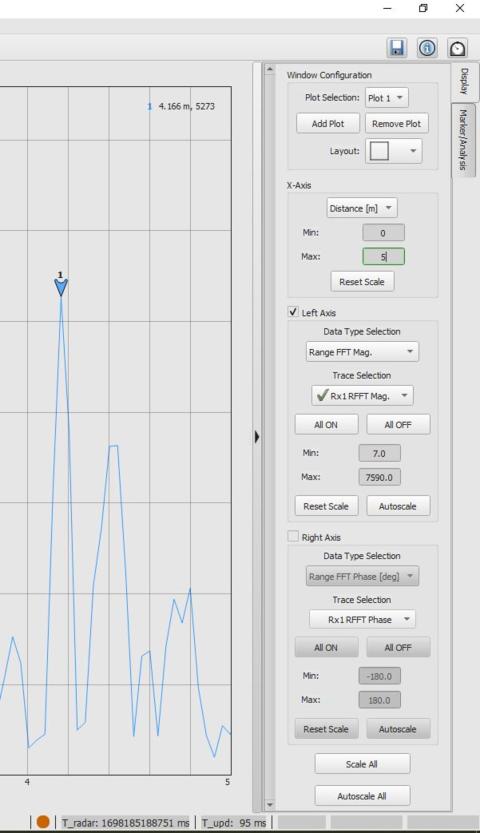
Right side for plot setting: Display and Marker/Analysis
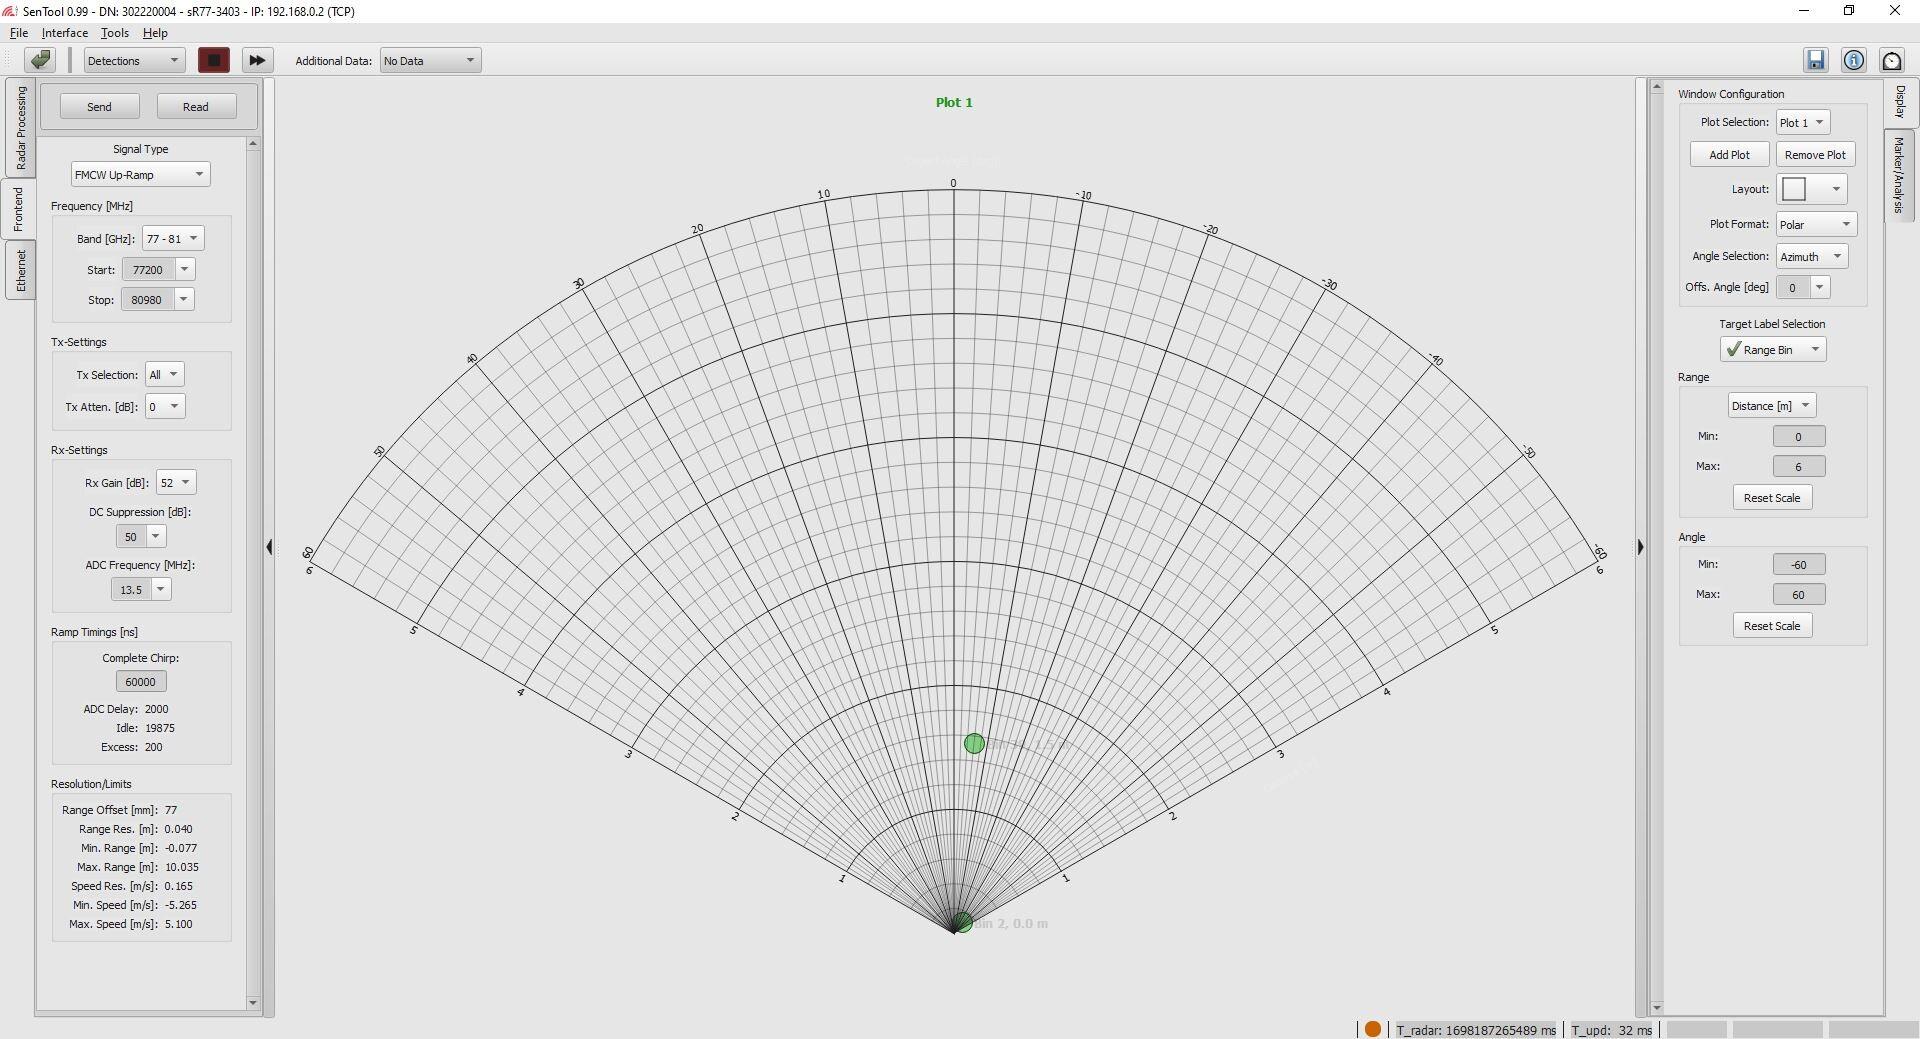
Polar Plot
Range-Doppler Map (klick to start video)
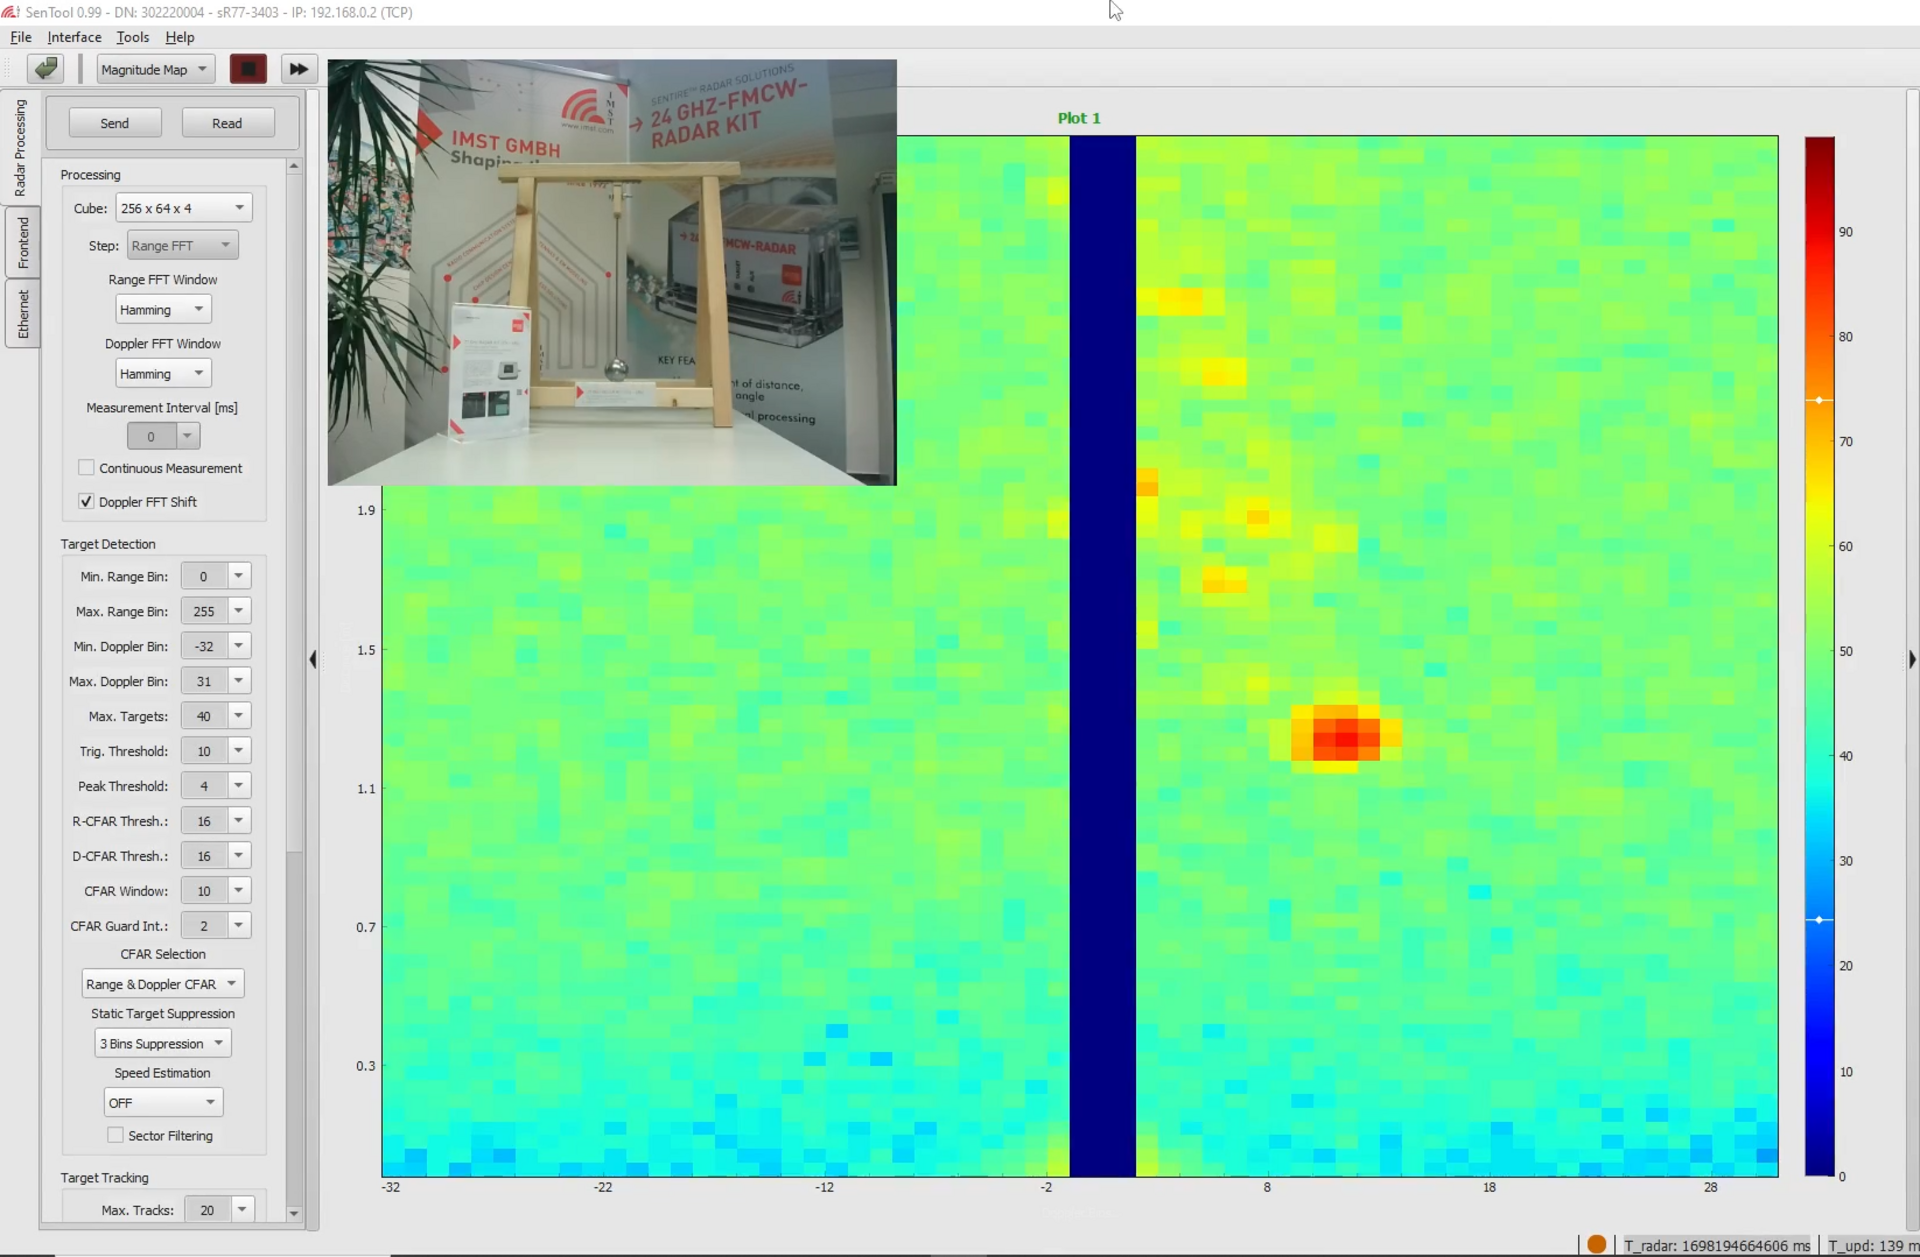
MetalSpherePendulum-A
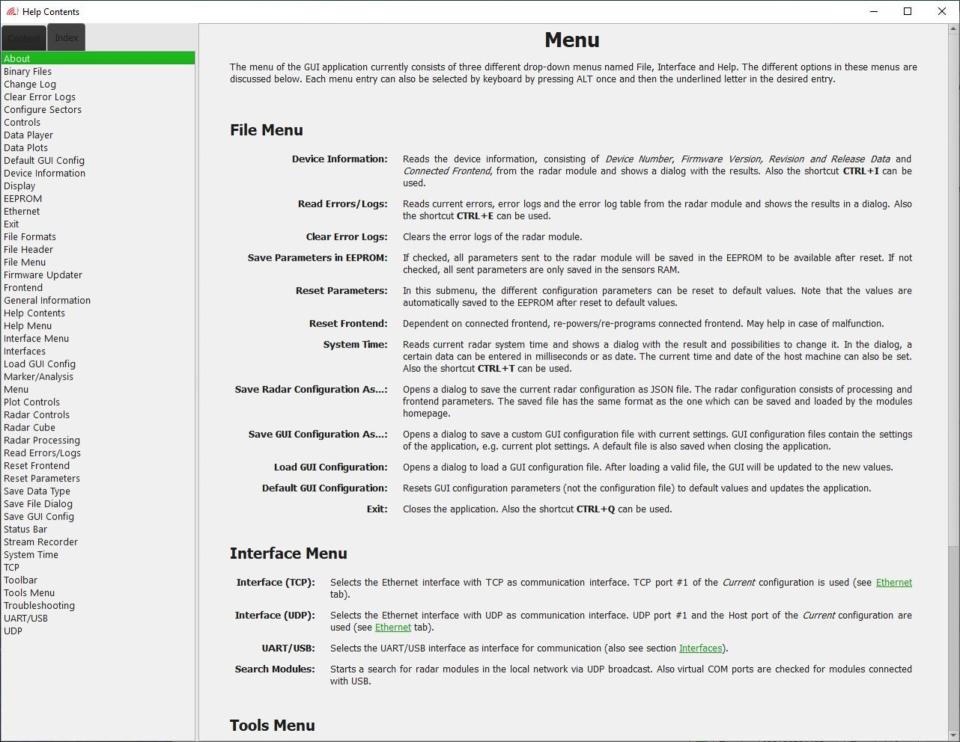
Inline Help
Tabs for Radar Parameter and Data Settings
Radar Processing
Display
Frontend
Marker/Analysis
Ethernet